Natural rubber content GWAS
GLM and MLM associations, model diagnostics and audited downloads.
GLM: PC1–PC3; MLM: PC1–PC3 and a standardized genomic relationship matrix. Interpretation is limited to this F1 family.
Genome-wide results for the selected model

Red dashed line: fixed exploratory screening at −log10(P)=4 (P≤1×10⁻⁴); gray dotted line: suggestive 1/M. Variants and candidate genes use the fixed cutoff; no empirical permutation calibration was performed.
View P≤1e-4 variants · View original Bonferroni reference plot
QQ plot and model statistics
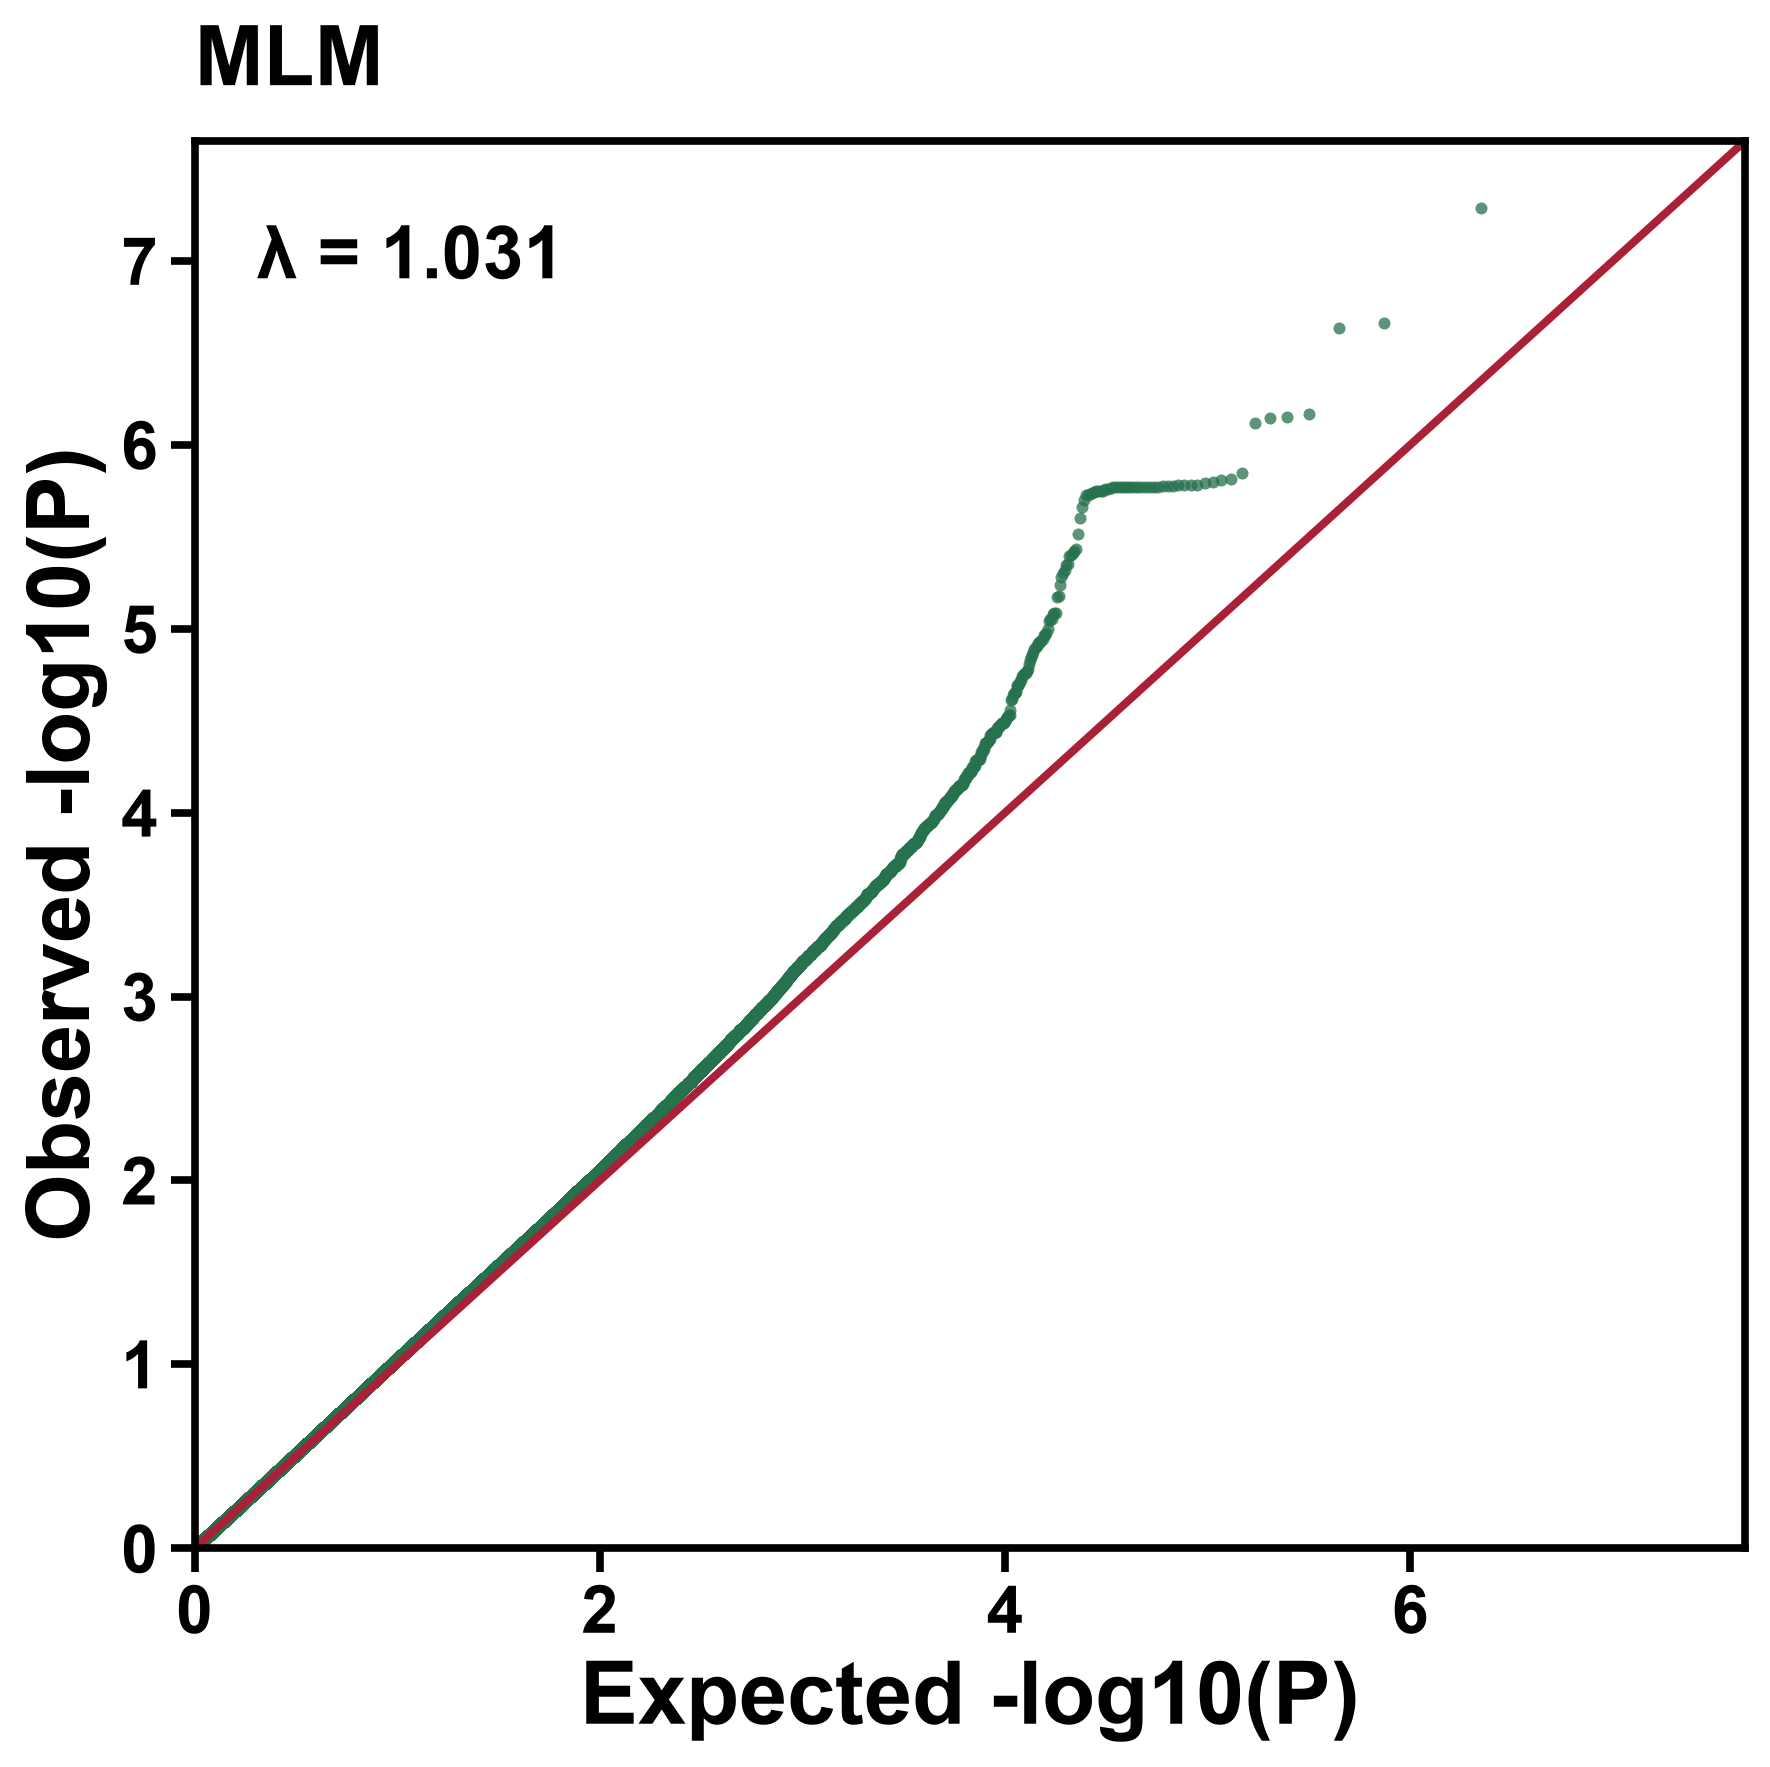
λ = 1.031;Genome-wide threshold P ≤ 4.5e-08。
MLM converged with the GRM variance component near its lower boundary. This conditional fit does not establish zero trait heritability; interpret it with the family design and robustness checks. V(G)=1e-05;V(e)=4.3028。
Filter association statistics
| Variant | Position (bp) | Effect allele | n | β | P | FDR q | Nearest gene |
|---|---|---|---|---|---|---|---|
| TK1151:2:41556449:A:G | Chr02:41,556,449 | G | 126 | 1.988 | 7.11e-07 | 0.0463 | TkA02G162070 |
Beta is the change in content percentage points per effect allele. Table filters do not alter the genome-wide plot above.
Methods, sources and scope
This is one F1 family. Phenotypes are published mean natural rubber contents; the VCF was generated by this project from CRA009020 reads. Sample correspondence is supported by unique exact read-count matches; consistency with the author’s original bin coding remains unresolved. Results support exploratory within-family association; candidates require independent validation.
Biallelic SNPs on8 chromosomes; nonvarying offspring GT dosage excluded; GT depth ≥5; variant missingness ≤10%; MAF ≥0.05; sample missingness ≤15%; no HWE filtering in the F1 family. GLM uses nonmissing genotypes per variant; MLM handles residual missing calls by its software defaults. Nearest genes indicate proximity; published marker intervals are not full QTL confidence intervals.
Yang et al., 2023Published QTLsMethods & versionsNumerical validationWorkflow & provenanceFurther analysis plan